Traffic Analysis for ether2 -- MikroTik
| System: | MikroTik in Office |
| Maintainer: | Scott |
| Description: | ether2 |
| ifType: | ethernetCsmacd (6) |
| ifName: | ether2 |
| Max Speed: | 125.0 MBytes/s |
| Ip: | No Ip (No DNS name) |
The statistics were last updated Thursday, 22 January 2026 at 5:06,
at which time 'MikroTik' had been up for 227 days, 4:06:12.
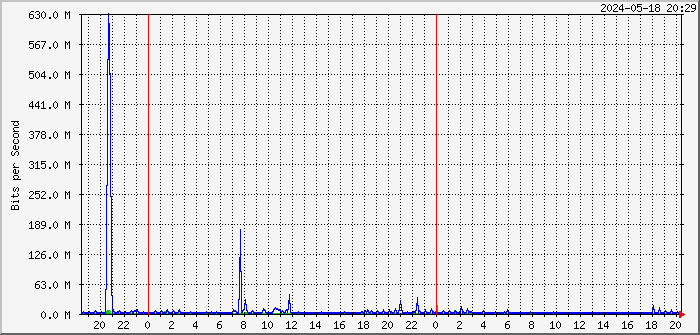
`Daily' Graph (5 Minute Average)

|
Max |
Average |
Current |
| In |
63.9 Mb/s (6.4%) |
3097.5 kb/s (0.3%) |
122.7 kb/s (0.0%) |
| Out |
852.6 Mb/s (85.3%) |
13.5 Mb/s (1.4%) |
3450.3 kb/s (0.3%) |
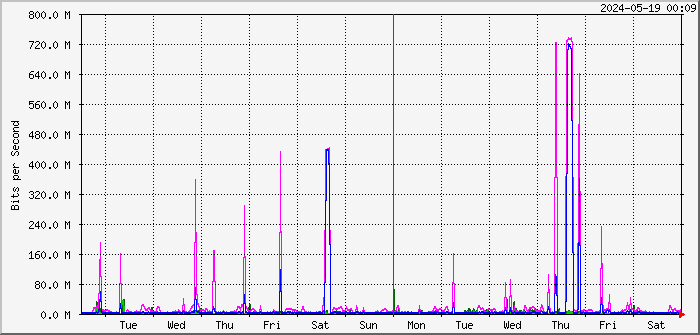
`Weekly' Graph (30 Minute Average)

|
Max |
Average |
Current |
| In |
66.5 Mb/s (6.7%) |
1296.2 kb/s (0.1%) |
716.3 kb/s (0.1%) |
| Out |
855.0 Mb/s (85.5%) |
7484.9 kb/s (0.7%) |
49.8 Mb/s (5.0%) |
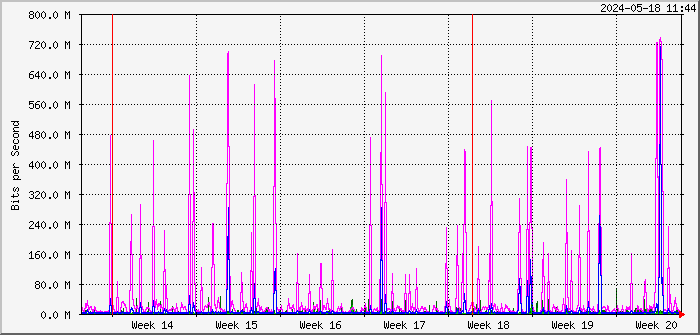
`Monthly' Graph (2 Hour Average)

|
Max |
Average |
Current |
| In |
117.1 Mb/s (11.7%) |
1253.3 kb/s (0.1%) |
394.4 kb/s (0.0%) |
| Out |
862.3 Mb/s (86.2%) |
5797.2 kb/s (0.6%) |
1900.9 kb/s (0.2%) |
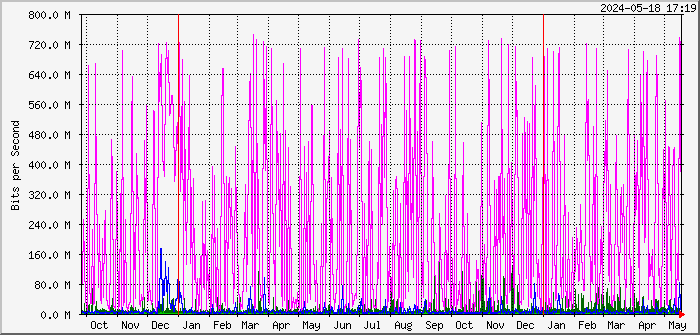
`Yearly' Graph (1 Day Average)

|
Max |
Average |
Current |
| In |
122.9 Mb/s (12.3%) |
1219.6 kb/s (0.1%) |
906.3 kb/s (0.1%) |
| Out |
899.9 Mb/s (90.0%) |
5784.5 kb/s (0.6%) |
23.6 Mb/s (2.4%) |
| GREEN ### |
Incoming Traffic in Bits per Second |
| BLUE ### |
Outgoing Traffic in Bits per Second |
| DARK GREEN ### |
Maximal 5 Minute Incoming Traffic |
| MAGENTA ### |
Maximal 5 Minute Outgoing Traffic |
Questions about this page? Contact the hostmasterPerformance Home
Switch Status
